Information Design
Data, Graphs, and lots of Information
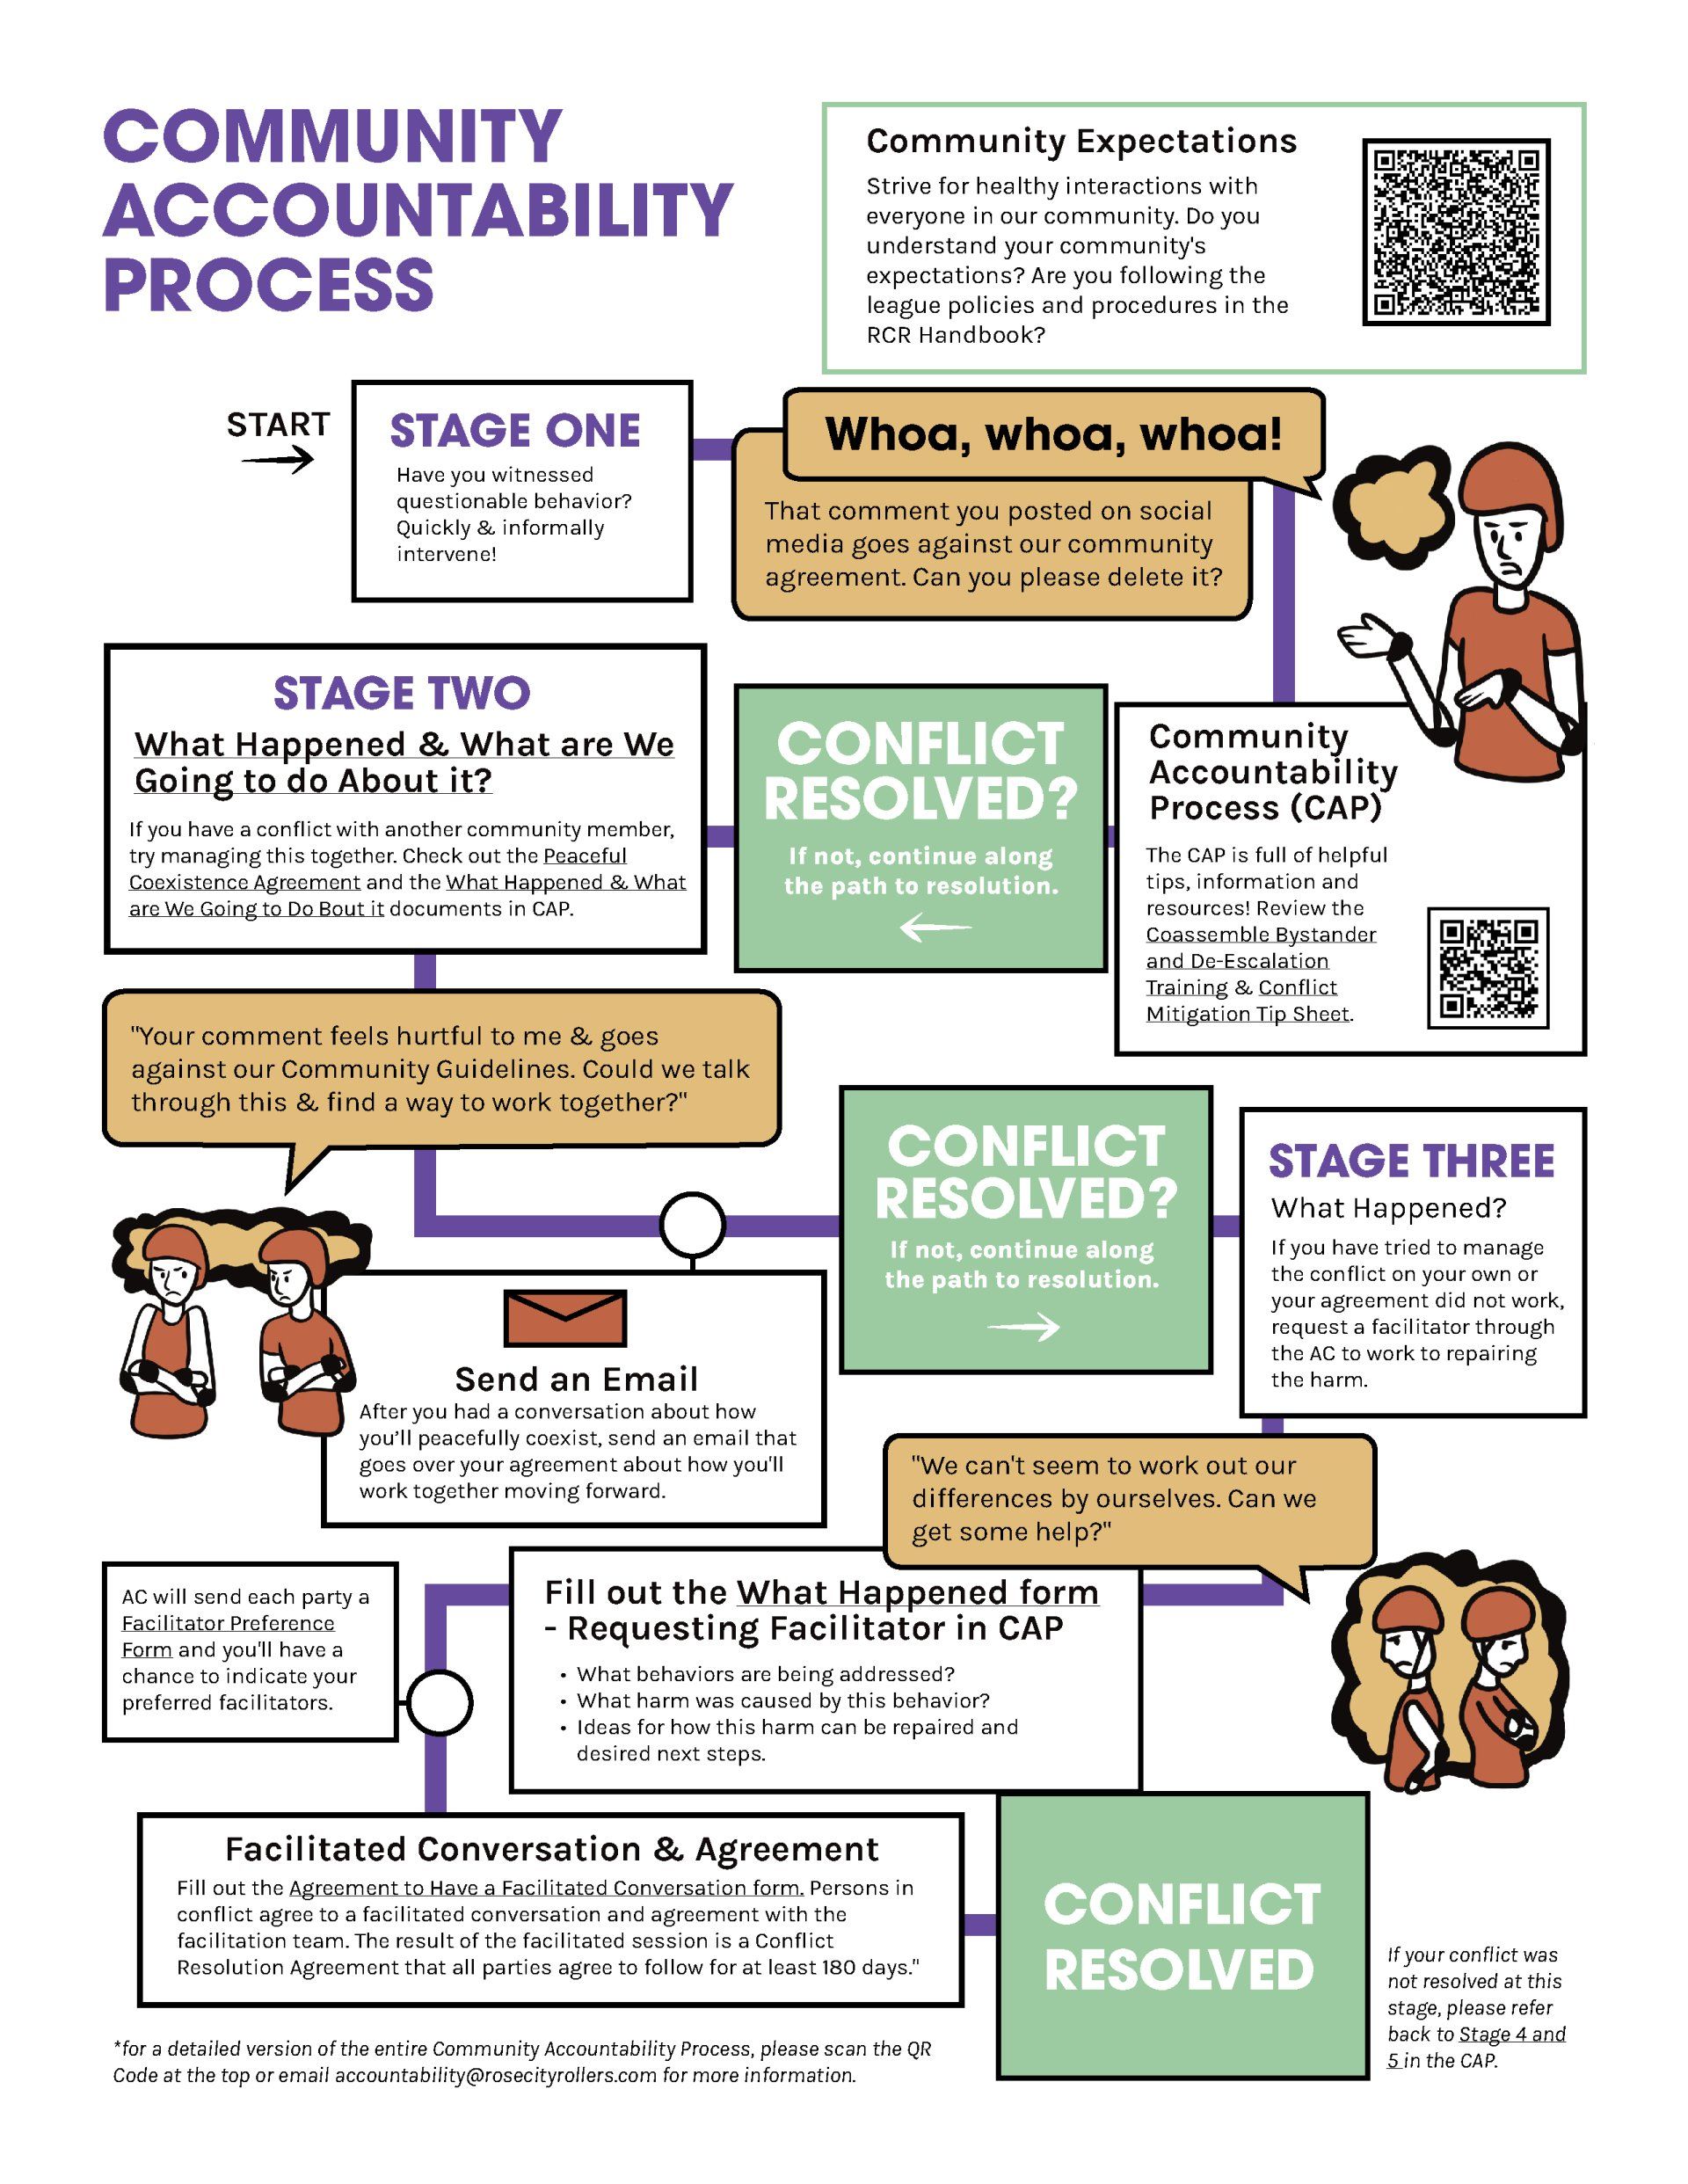
Rose City Rollers - Accountability Flowchart
This was a project completed professionally for my work with Rose City Rollers. The project was a refresh of their accountability process. This is an informational document in our community handbook which members can utilize if they find they are in conflict with another member. I was tasked with organizing and designing this flowchart to fit the needs of the administration and contain all the necessary legal and official language of the process.
Timeline Of British Monarchs
This project was about condensing the reigns of all British monarchs into one cohesive timeline. The key pieces of information I intended to make clear are: Who are all the British monarchs? When did they rule and for how long? And, what does the entire timeline look like? For some bonus information I also included how the Royal Coat of arms Changed to reflect the territories that were lost/gained during this time. This Infographic was made in 2020 before the ascension of King Charles the Third.

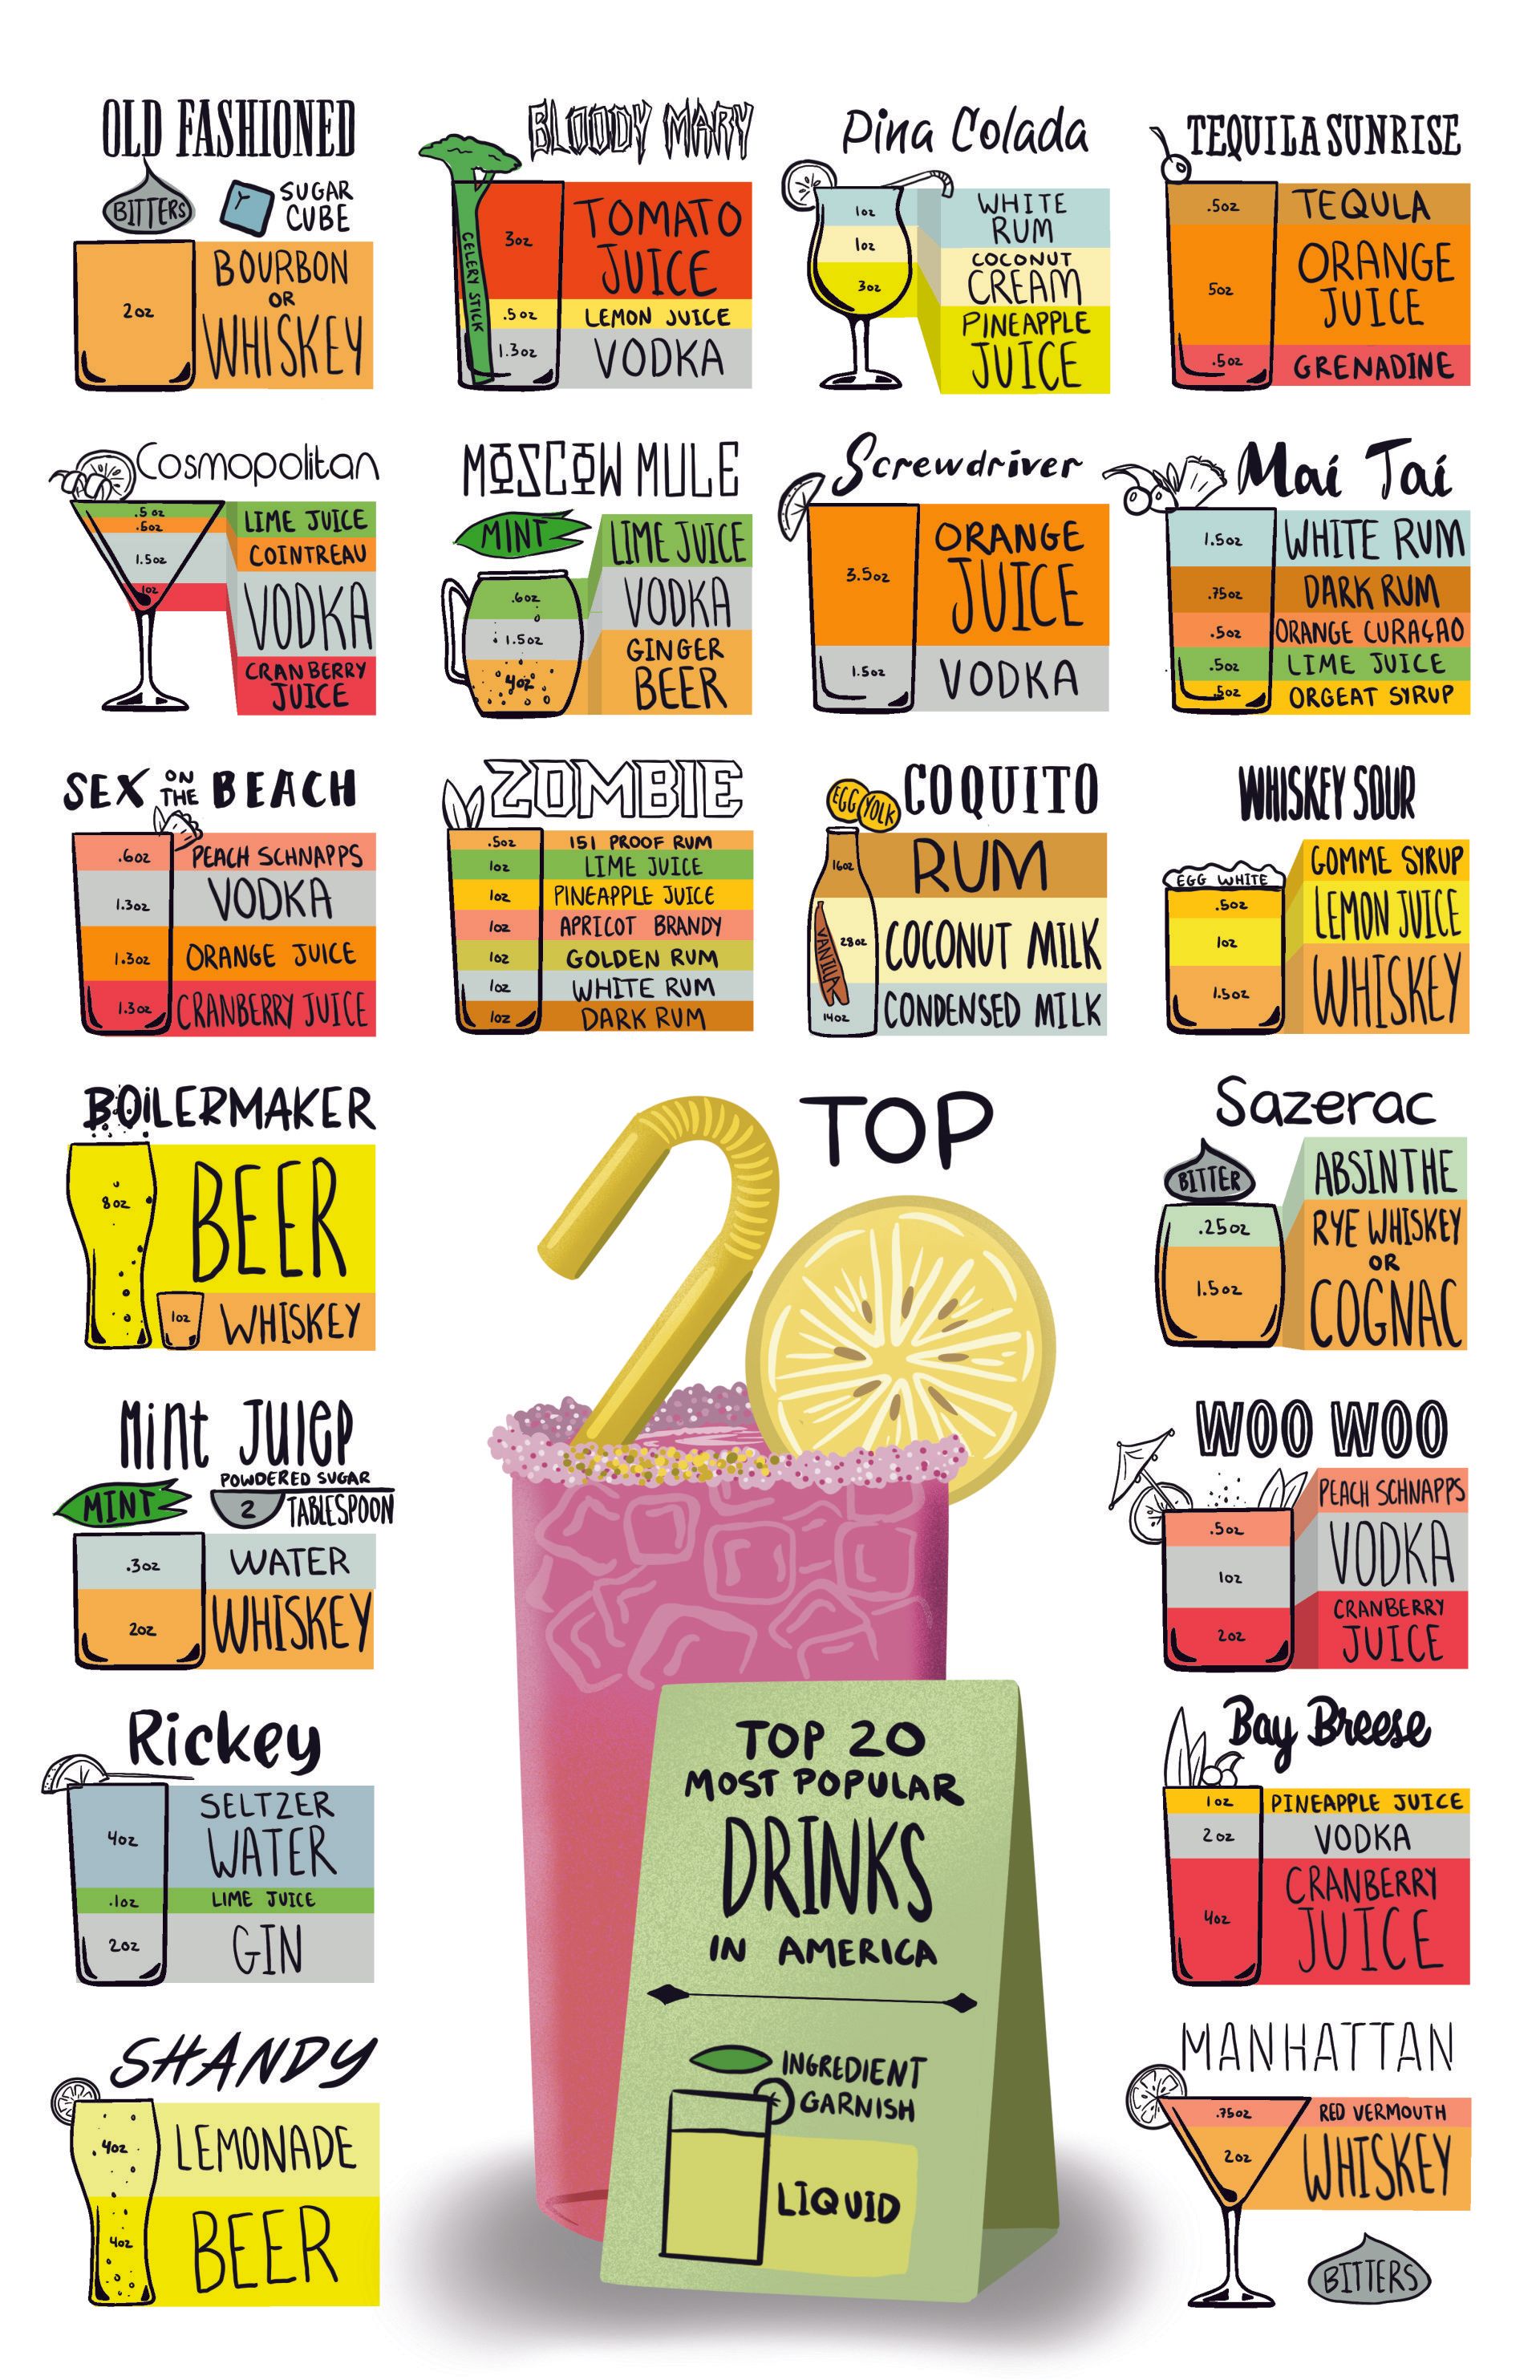
The 20 Most Popular Drinks in America
This project aimed to show which alcoholic drinks were the most popular in America. I intended to show not only which were popular, but what their recipes are, and what vessel they are commonly served in. The Infographic was developed at tabloid size because its intent was to be printed and hung in restaurants and bars.
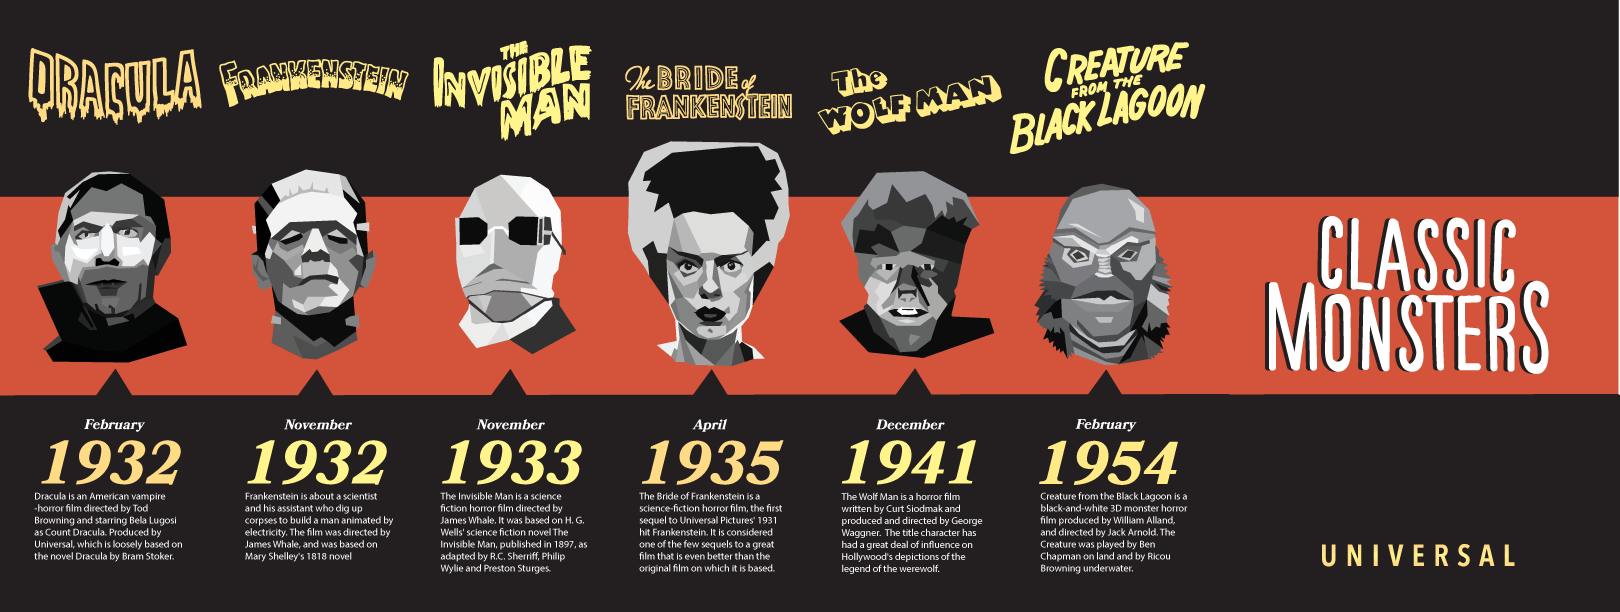
Timeline of Classic Monster Movies
This is an accordion fold pamphlet which on one side displays a timeline of the classic Universal monster films and on the other showcases and illustration of the characters.